Portál AbcLinuxu, 4. července 2026 13:39
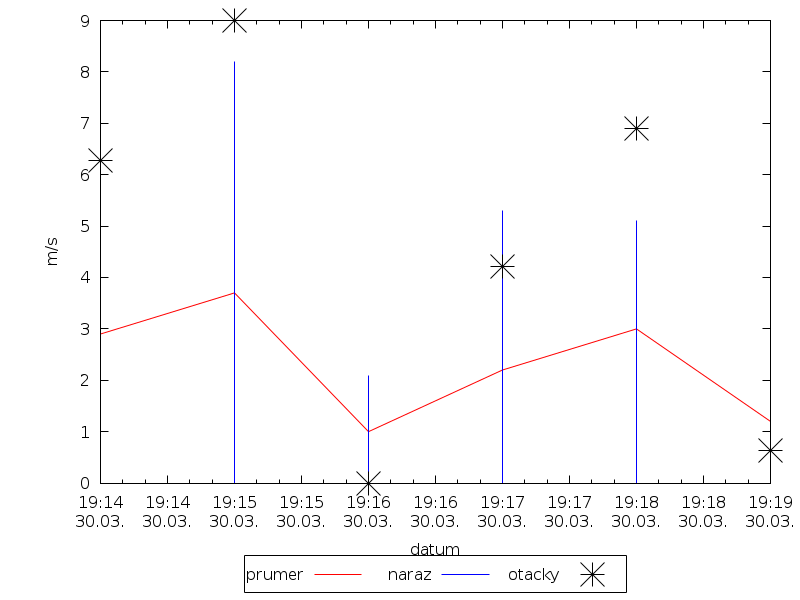
#datum a cas   prumer  naraz  otacky
2016-03-30 19:19:00 1.2 3.0 106
2016-03-30 19:18:00 3.0 5.1 274
2016-03-30 19:17:00 2.2 5.3 202
2016-03-30 19:16:00 1.0 2.1 89
2016-03-30 19:15:00 3.7 8.2 330
2016-03-30 19:14:00 2.9 5.9 257
Můj gnuplot script:
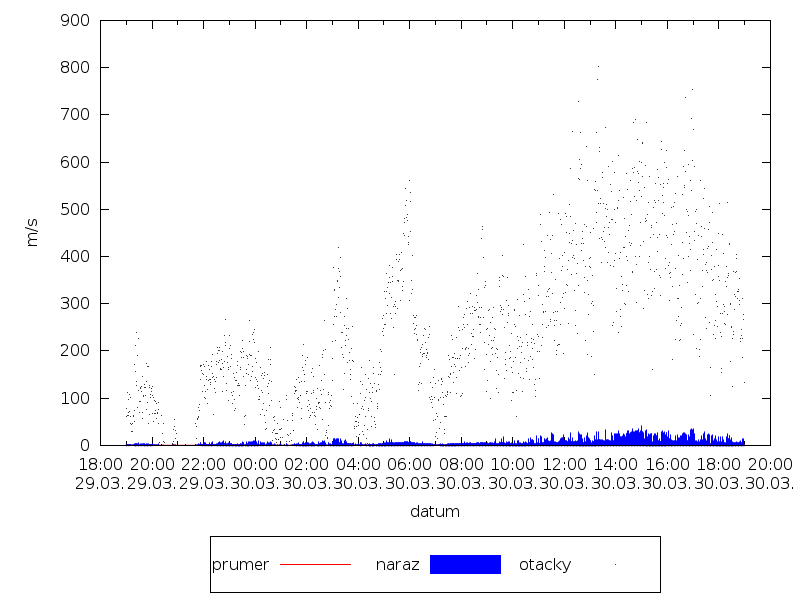
#!/usr/bin/gnuplot

set terminal png crop    #output format of graph
set term pngcairo size 800,600    #resolution
set output "/var/www/temp.png"    #name of output file
set xlabel "datum"    #horizontal axis name
set ylabel "m/s"    #vertical axis name
#set yrange [auto:auto]    #vertical axis range (optional line)
set xdata time    #x axis is not numbers, but dates/times
set timefmt "%Y-%m-%d %H:%M:%S"
set format x "%H:%M\n%d.%m."

set style line 1 lc rgb "red"
set style line 2 lc rgb "blue"
set style line 3 lc rgb "black"

set boxwidth 0.1
set style fill solid

set pointsize 4

set lmargin 10
set key below box height 1
set style increment user

plot "/home/pi/tmp/wind_60.dat" using 1:3 title "prumer" with lines lt 1 lw 1, \
"/home/pi/tmp/wind_60.dat" using 1:4 title "naraz" with boxes, \
"/home/pi/tmp/wind_60.dat" using 1:5 title "otacky" with dots
 30.3.2016 22:26
wamba | skóre: 38
| blog: wamba
30.3.2016 22:26
wamba | skóre: 38
| blog: wamba
set autoscale y2

plot "./wind_60.dat" using 1:3 title "prumer" with lines lt 1 lw 1, \
"./wind_60.dat" using 1:4 title "naraz" with impulses, \
"./wind_60.dat" using 1:5 title "otacky" with points axes  x1y2
nejsou tam detaily jako popsána y2 atp.,
30.3.2016 22:30
wamba | skóre: 38
| blog: wamba
Tiskni
Sdílej:
![]()
![]()
![]()
![]()
![]()
![]()
ISSN 1214-1267, (c) 1999-2007 Stickfish s.r.o.