Přední technologické společnosti (Adobe, Cadence, Capital One, Cisco, Cloudera, Cloudflare, Cognition, CrowdStrike, Databricks, Dell Technologies, DoorDash, Elastic, HPE, Hugging Face, IBM, LangChain, Linux Foundation, Microsoft, NAVER, NetApp, Nous Research, NVIDIA, OpenClaw, Palantir, Palo Alto Networks, Red Hat, Reflection AI, Salesforce, SAP, ServiceNow, Siemens, SK Telecom, Snowflake, SpacexAI, Synopsys, Thinking
… více »Krabix.cz je online 3D konfigurátor krabiček pro 3D tisk s exportem do STL. Běží přímo v prohlížeči. Nic se neposílá na server.
Nadace Open Home Foundation spustila veřejnou preview verzi komunitní databáze zařízení pro Home Assistant. Má fungovat jako „Wikipedie pro chytrá zařízení".
Na stránce nového panelu Firefoxu přibudou nové widgety. Například denně aktualizována interaktivní křížovka.
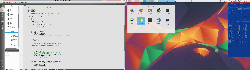
PGSimCity (GitHub) je webová 3D vizualizace vnitřního fungování databázového systému PostgreSQL v podobě města. Vytvořena pomocí umělé inteligence.
UBports, nadace a komunita kolem Ubuntu pro telefony a tablety Ubuntu Touch, vydala Ubuntu Touch 24.04-2.0 a 24.04-1.4. Nová verze 24.04-2.0 již počítá s výřezy pro fotoaparát (notch) a zaoblenými rohy displeje. Webový prohlížeče Morph přešel z Chromia 87 na Chromium 134. Do shellu Lomiri byl přidán editor snímků obrazovky.
Byly zveřejněny informace o kritické zranitelnosti CVE-2026-64600 pojmenované RefluXFS (technické detaily) v XFS. Je tam již od verze Linuxu 4.11, tj. rok 2017. Jedná se o lokální eskalaci práv. Neprivilegovaný uživatel může editovat libovolný soubor, například klidně zrušit rootovské heslo v /etc/passwd. Videoukázka na Vimeo. V upstreamu je zranitelnost opravena.
OpenAI / ChatGPT má dnes výpadky (OpenAI Status, DownDetector).
Poskytovatel hostingu svobodných/open-source projektů Codeberg po hlasování na valné hromadě vydal stanovisko k využívání LLM. Kvůli vytěžování infrastruktury a rostoucím cenám hardwaru, ale také hrozbám pro spolupráci v komunitě se k LLM staví kriticky. Nebude poskytovat hosting projektů vytvářených LLM agenty.
Jack Dorsey představil (𝕏) open source týmovou komunikační platformu Buzz (GitHub) s cílem snížit závislost na Slacku a GitHubu.
Programming stuff. And stuff.
git checkout https://github.com/orbcode/orbuculum
cd orbuculum
git checkout Devel
make
Notice file Support/gdbtrace.init, this contains lot of magic macros, we'll use it later.
JLinkGDBServerCLExe -select USB -device Cortex-M4 -endian little -if SWD -speed auto -ir -LocalhostOnly
In GDB, connect to the server. This expects you have the Support dir from orbuculum in current directory.
Magic incantations below. This is for CPU core clock of 168 MHz, look at the gdbtrace.init's comments to
see what the arguments are. The monitor SWO EnableTargeT is part of JLink's GDB server, see
JLink user guide.
The selected SWO speed below is 2000000 baud. You may have to reset target first via monitor reset.
The parameters below select PC sampling that shouldn't be too fast, otherwise you'd get a lot of ITM overflows.
DWT POSTRESET setting is important in this.
target extended-remote :2331
source Support/gdbtrace.init
monitor SWO EnableTarget 168000000 2000000 0xFF 0
enableSTM32SWO 4
prepareSWO 168000000 2000000 0 0

dwtSamplePC 1
dwtSyncTap 3
dwtPostTap 1
dwtPostInit 1
dwtPostReset 15
dwtCycEna 1

ITMId 1
ITMGTSFreq 3
ITMTSPrescale 3
ITMTXEna 1
ITMSYNCEna 1
ITMEna 1

ITMTER 0 0xFFFFFFFF
ITMTPR 0xFFFFFFFF
continue
Now you should see some output if you do nc localhost 2332 to some file swo_data (port belongs to JLink GDB server and
should pump out SWO data).
You can use pcsampl utility from these ITM tools. Let's try to
parse the file you dumped from the port 2332, firmware.elf is the firmware running on your board:
./pcsampl -e firmware.elf swo_file 2>/dev/null
If the data are correct, you should see some meaningful result like:
    % FUNCTION
10.77 *SLEEP*
29.76 qstr_find_strn
13.71 gc_collect_end
 6.97 mp_map_lookup
 6.00 gc_mark_subtree
 5.37 gc_alloc
 4.71 mp_execute_bytecode
 3.63 sha256_Transform
 1.80 mp_obj_get_type
You can also watch with orbtop which is part of orbuculum (look in ofiles directory). This will
take data from JLink's SWO port 2332, show exceptions, max 15 lines. It's like top, it just shows
time spent in functions instead:
./orbtop -E -e firmware.elf -v3 -c 15 -s localhost:2332
Sample output if all goes well:
 25.51%     2712 bn_multiply_reduce_step
 12.18%     1295 frexpf
 12.18%     1295 bn_multiply_long
  7.79%      828 qstr_find_strn
  4.65%      495 display_loader
  3.11%      331 gc_mark_subtree
  2.91%      310 mp_map_lookup
  2.26%      241 gc_alloc
  2.12%      226 bn_multiply_reduce
  2.11%      225 mp_execute_bytecode
  1.72%      183 sha256_Transform
  1.52%      162 bn_subtract
  1.43%      152 bn_add
  1.37%      146 bn_is_less
  1.27%      135 bn_rshift
-----------------
 82.13%     8736 of 10627 Samples


 Ex |   Count  |  MaxD | TotalTicks  |  AveTicks  |  minTicks  |  maxTicks
----+----------+-------+-------------+------------+------------+------------

[---H] Interval = 1018mS / 0 (~0 Ticks/mS)
monitor SWO EnableTarget 168000000 3000000 0xFF 0
Don't ask me why. I am just an engineer. I measured it with logic analyzer and kept guessing
the baudrate until it fit. According to ARM docs, SWO clock/prescaler should mostly
depend only on CPU core clock. However it evidently doesn't. There were some other hints in
docs when it's not based on CPU core clock, but that was different case. Though there could
be issue with the core clock config that seems only appear when enabling SWO data.
target extended-remote :3333
source Support/gdbtrace.init
monitor tpiu config internal swodump.log uart off 168000000 2000000
monitor mmw 0xE0001000 69632 0
monitor mmw 0xE0001000 103 510
dwtPostReset 15
set *0xe0001000=*0xe0001000 | 0x200
continue
It's a bit hairy mess, but should work (168 MHz core clock and 2 Mbaud SWO). If you are lucky and
have the right STLink FW version, swodump.log file should appear in the directory where openocd was run.
You can decode it as above with pcsampl.
If the swodump.log file is empty, you have the bad STLink FW version. You have to workaround
via USB-UART adapter on SWO pin.
Set baudrate to 2 Mbaud, look at screen if it spews data. It's actually important to run screen
as it seems to set some flags along with the stty. Might be issue with specific adapter.
stty -F /dev/ttyUSB0 2000000
screen /dev/ttyUSB0 2000000 # look if data is flowing, then kill screen
stty -F /dev/ttyUSB0 2000000
Now you can either dump data via cat from /dev/ttyUSB and decode with pcsampl or
you can run orbuculum with orbtop (each in separate terminal).
Both binaries below are in ofiles directory of orbuculum.
./orbuculum -p /dev/ttyUSB0 -a 2000000 -v2
./orbtop -E -e firmware.elf -v3 -p /dev/ttyUSB0 -a 2000000 -v2
If succesful, you'll see the the orbtop output like above.
 There are also some IDEs that could work with enabling this, like STM32 Cube IDE, however they have their own bugs. E.g. the Cube IDE definitely can't handle longer sampling because it tries to store everything into memory and in a very wasteful way at that. Even then it has problem with desync from adapter (this can be the FW issue) and depending on board will compute often wrong ITM settings, likely also the STLink FW issue.
It is possible to generate KCachegrind output with orbuculum, but so far I haven't had much success with it.
There are also some IDEs that could work with enabling this, like STM32 Cube IDE, however they have their own bugs. E.g. the Cube IDE definitely can't handle longer sampling because it tries to store everything into memory and in a very wasteful way at that. Even then it has problem with desync from adapter (this can be the FW issue) and depending on board will compute often wrong ITM settings, likely also the STLink FW issue.
It is possible to generate KCachegrind output with orbuculum, but so far I haven't had much success with it.
Tiskni
Sdílej:
![]()
![]()
![]()
![]()
![]()
![]()
 AbcLinuxu.cz
 ITBiz.cz
 HDmag.cz
 AbcPráce.cz